
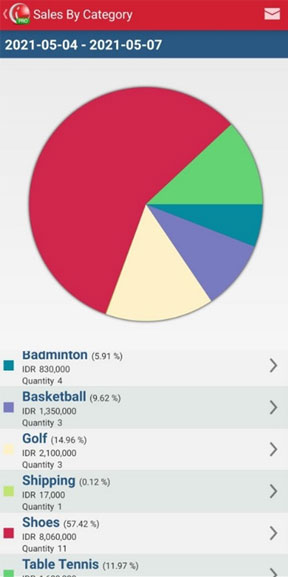
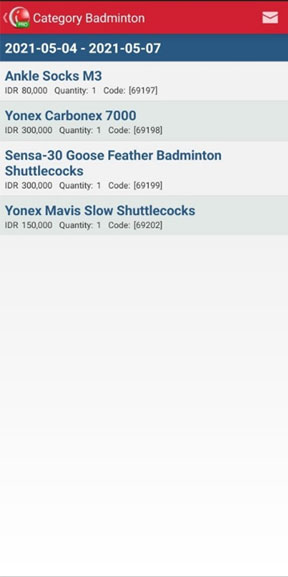
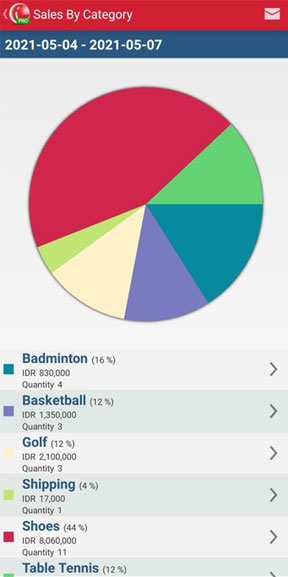
Sales reports per category on IREAP POS PRO will show sales data based on product categories that you sell that occur at the outlet, besides that you can see in detail the sales for that category, within the period you have specified. You will get data on product categories, total sales per category, total nominal sales per category and average total sales of all categories in the form of a percentage graph.
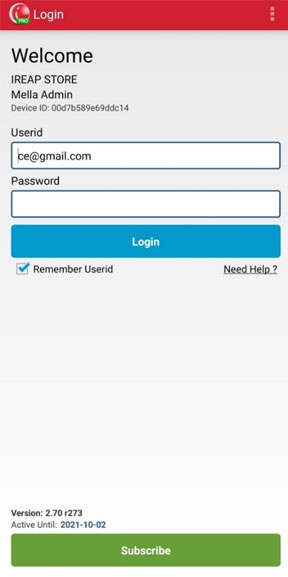
Login to the IREAP POS PRO application
NOTE:
This step is specifically for IREAP PRO users
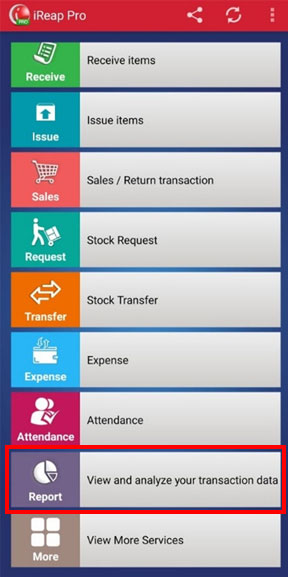
Select the Report menu
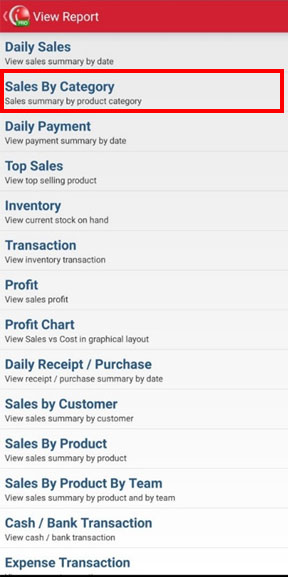
Click Sales By Category
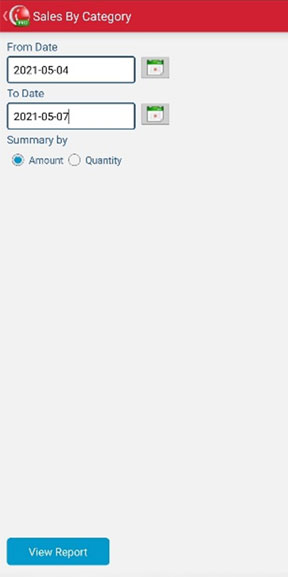
Set the date as desired (for example: sales from 2021-05-04 to 2021-05-07) > Select a summary based on Value / Quantity > click view report.
a. Here's a summary view by Value
NOTE:
You can click a category to see details
b. The following is a summary view based on the Quantity
iREAP POS : iREAP stand for Integrated Retail Application, is an application designed and developed to help you managed and run store operation, consists of Point of Sale / Cashier system and inventory control system.